Welcome to another data blog post from Bondora, below we take a look in to the actual and targeted net returns from investments by country, year and quarter. It’s important to note that the most recent quarter will nearly always show a higher return as the loans have only recently been issued and at this point the interest element accounts for a high percentage of the total payment.
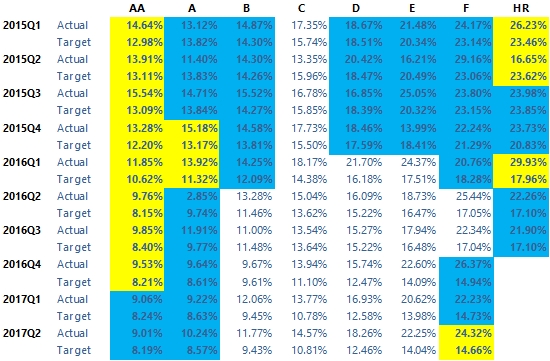
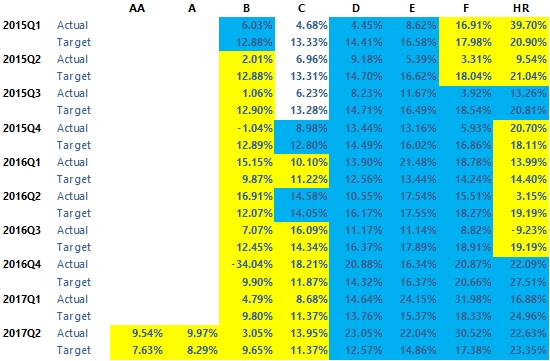
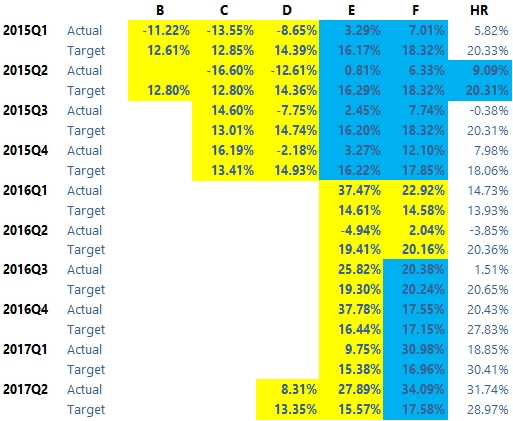
We have marked the figures with three different colours, firstly yellow to represent less than 50 loans issued, blue for 51 – 200 and white for over 201. This is a great way to spot anomalies, such as high volatility in low risk ratings.
Key takeaways
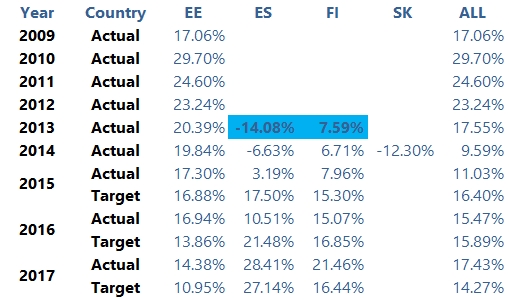
- From 2009 – 2013, the lowest overall return across all countries and risk ratings was 17.06%.
- The highest actual return was seen in 2010, at 29.7%.
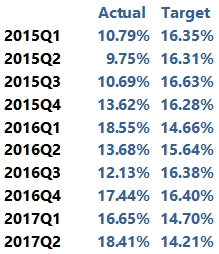
- The target return rate has been stable over the 10 quarters, varying by a maximum of 2.42% overall.
Estonia
- Actual returns exceeded target returns in all credit ratings other than ‘A’ in Q1 of 2015.
- This trend was the same in Q1 of 2016, where the actual return was above the target return in all cases.
Finland
- AA & A rated Finnish loans were introduced in Q2 of 2017, now Finland is the only country with loans in each risk rating.
- Only a small percentage of Finnish loans issued were over a total of 200 PCS, resulting in an apparent volatility in the net return each quarter.
- In Q4 of 2015 for B rated loans, only 4 loans were issued.
Spain
- HR rated loans have seen returns ranging from -3.85% to 31.74%. For those who do not like volatility in their portfolio, we encourage a mix of different credit ratings to subsidize frequent monthly fluctuations.
Actual and targeted Bondora net returns across the portfolio per quarter
The target return rate has been stable over the 10 quarters below, varying by a maximum of 2.42% overall.
Actual and targeted Bondora net returns across previous years
In general, as more time passes and as loans continue to receive interest and a cash flow from recoveries, this is when the overall net return is most accurate.
This is a great article to compare with our recent monthly series post’s discussing the distribution of credit ratings and origination.
Remember, to maximize your net return you should view investing with Bondora as something long term.