Our Statistics pages, both public and private, have been quite popular amongst our investors and site visitors. The purpose of these statistics is to give the investor a quick visual glance of Bondoras various performance indicators. Today we look at the private statistics page and explain a little bit closer one the most important metrics for the investor – the net return on investment.
After you’ve logged in to Bondora account, the private statistics page is available from the left menu. At the top of your Statistics page, you can see two net return statistics – „Your Annualized Return on Investment“ and „Annualized net return on investment over time“.
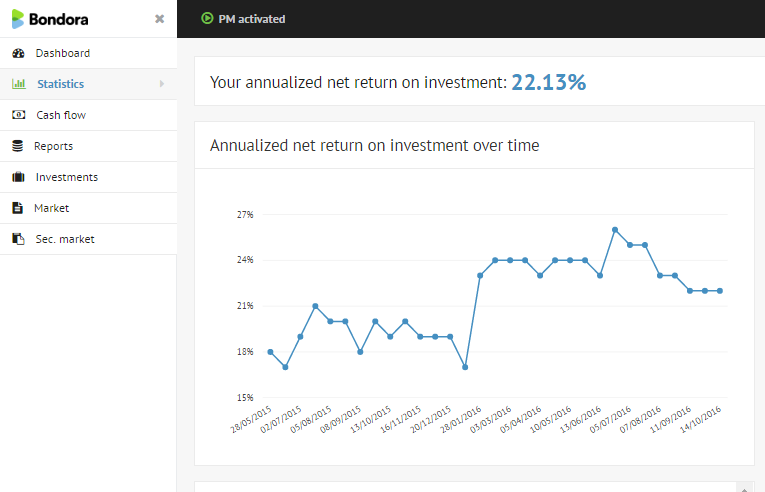
They are essentially one and the same with the difference that the former displays a current value and the latter shows current value + historical values on a graph. The historical values give a visual overview of the progress of your portfolio performance. You can also compare the curves of your own portfolio with Bondoras overall net return statistics across all portfolios on the public statistics page. The historical net return values on the graph are given as monthly data points up to the most current value. This means that the latest data point in „Annualized net return on investment over time“ is equal to the value of „Your Annualized Return on Investment“. The only exception to this can be when you use the Forecast Settings to calculate your account value.
Bondora calculates the net return using XIRR, known as Extended Internal Rate of Return. This is a common method of calculating ROI for cash flows when they are irregular, unlike a mortgage that is paid the same amount monthly over time.
XIRR is also a very useful Excel function. You can find a lot of guides and material with Google search on how to make your own net return calculations using XIRR function in Excel. Some of these examples you can see from articles of Lend Academy and P2P Lending Expert.
We will focus on the other Statistics page reports, like “Investment statistics by criteria” and “Investment risk profile”, in our future posts.