Welcome to our quarterly post on the portfolio distribution of Go & Grow. Since its release to all investors in June 2018, it’s proved to be incredibly popular – in a short time; it has overtaken our other products as the most popular way to invest with Bondora.
If you’re interested in how Go & Grow earns a net return of 6.75%*, this post is exactly what you’re looking for. Below, we go into detail about how the claims added to Go & Grow are distributed, what the most common ratings are, the most popular goal chosen by investors and more. Since this is the second post in our series, we’ll make some comparisons to the previous data so you can see how this has changed over time.
In case you’re hearing about Go & Grow for the first time, here’s everything you need to know.
After receiving feedback from thousands of our investors who wanted something simple, with fast liquidity and low risk – Go & Grow was the answer. Traditionally, a limitation in P2P lending is the liquidity. And despite not being a short-term product, Go & Grow gives investors total control of their money.
Here’s a snapshot of the top ten benefits:
- 6.75%* p.a. net return
- Faster liquidity
- Lower risk
- Invest with a minimum of €1
- No annual management fees
- Tax-efficient
- Simple to use – making it great for beginners
- Create multiple accounts
- Share access to your Go & Grow account with the people you trust
- Create a goal and receive updates on your progress
Are there any associated fees?
We charge a flat €1 withdrawal fee, no matter the size of the account. This helps us continue to operate the Bondora platform.
Want to know more about Go & Grow? Click here.
How does Go & Grow work?
If you’ve read any of our other blog posts, you’ll know we always preach diversification. Instead of investing everything into one credit rating, Go & Grow spreads the claims across all eight credit ratings, ranging from AA-HR. The lowest distribution is in AA ratings, followed by A and HR.
Figure 1a – Go & Grow Portfolio Overview (rounded figures) – January 2019

Figure 1b – Go & Grow Portfolio Overview (rounded figures) – August 2018
The largest distribution is in F rated loans (37.2%), followed by E (16.9%), D (15.52%) and C (13.66%). Not only does Go & Grow consist of over 50,000 loan pcs, but our investors also benefit from diversification that traditionally could only be achieved with services such as Portfolio Manager and Portfolio Pro (or an API).
Compared to August, the percentage of F rated loans within the portfolio has risen by 16%. Why is this? As a by-product of issuing more loans in Finland and acquiring new customers, we’ve taken a conservative approach by assigning more borrowers a Bondora Rating of F.

Figure 2a – Go & Grow Portfolio Overview (Expanded) – January 2019

Figure 2b – Go & Grow Portfolio Overview (Expanded) – August 2018
Estonia still accounts for the largest share of the total at 50%, closely followed by Finland at 46%. The share of Spanish loans is clearly in the minority, at 4% of the total. Compared to August, the share between countries has become more equally spread between Estonia and Finland.
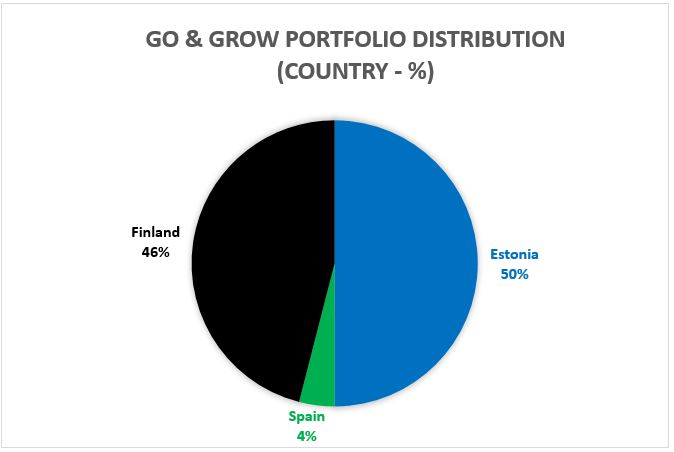
Figure 3a – Go & Grow portfolio distribution by country – January 2019

Figure 3b – Go & Grow portfolio distribution by country – August 2018
Below (Figure 4a & 4b), the graphs show the total distribution of originations across Bondora in December 2018 and July 2018, respectively. If you compare figures 1a, 2a, and 3a with 4a, you can see that the distribution of Go & Grow claims essentially mirrors that of the whole Bondora portfolio. We publish a monthly update on this – click here to read more.
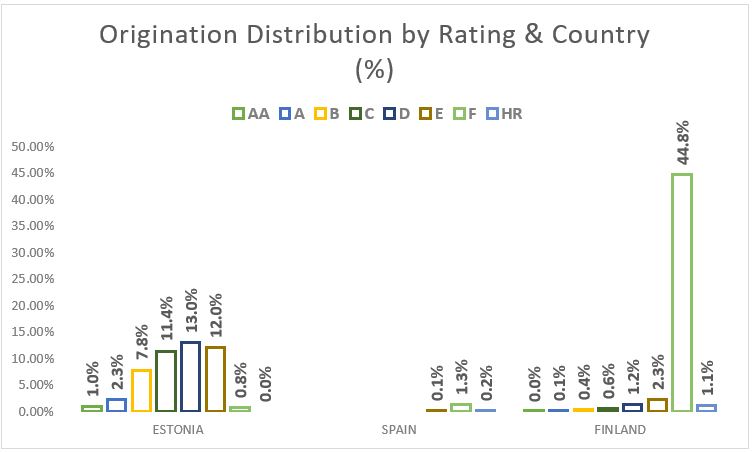
Figure 4a – Total Bondora origination by rating and country – December 2018 – (€8,448,570 total originations)

Figure 4b – Total Bondora origination by rating and country – July 2018 (€5,421,345 total originations)
Another interesting point for review is the different goals our investors are striving for. The clear majority is for extra income (66%). However, this is likely to be skewed due to it being the default option. After that, Rainy Day (11%), Retirement (9.1%) and Big Purchase (8.3%) follow as the most popular goals.

Figure 5a – Investors chosen goal – January 2019
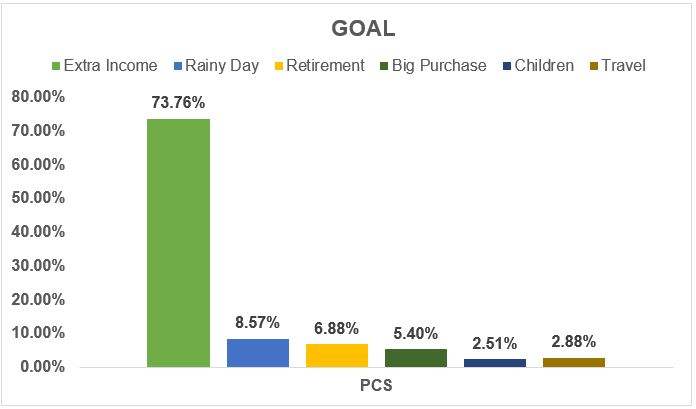
Figure 5b – Investors chosen goal – August 2018
What’s your goal? Let us know in the comments!
*As with any investment, your capital is at risk, and the investments are not guaranteed. The yield is up to 6.75%. Before deciding to invest, please review our risk statement or consult with a financial advisor if necessary.
