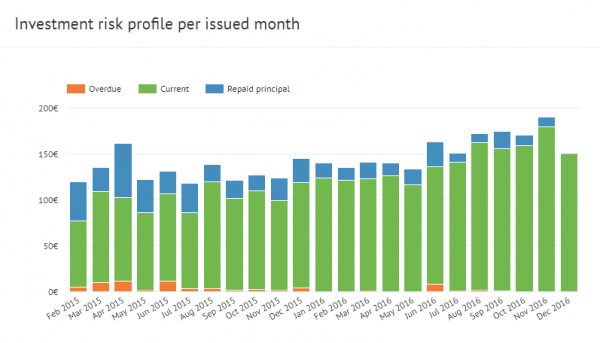
The monthly risk profile graph in the private statistics page gives users the ability to monitor their exposure to overdue loans. The wise investor is one who knows their tolerance for risk. Therefore, the risk profile chart is critical because it enables investors to see if the repayment performance is in keeping with their expectations.
Over the long-term some investors may choose to ensure that the overdue portion of their holdings remains at a reasonable level. User may also wish to balance this performance with their desired total return.
To a degree there is a connection between the individual’s risk profile chart and the total Bondora recovery data reported monthly. If a user experiences an increase in the overdue proportion of their holdings they may become more interested in the success of Bondora’s recovery efforts.
Finally, the chart represents how well the Portfolio Manager is adhering to the investment style the user selects. As we have explained in previous posts, terms like “conservative” and “aggressive” are not comparable to other investment instruments (e.g. stock, bonds, etc.). Therefore, a new user on the Bondora platform may underestimate the risk exposure of even a conservative strategy.
This chart works best when viewed as a part of a larger picture in the private statistics page. Using all the data available creates a dimensional picture to empower the user to control their investments and ensure the combination of risk and return works for them.